Decoding RTP Rates: What Statistical Analysis Reveals About Casino Game Returns
Written by Otto Brooks · Nov 3, 2026
Decoding RTP Rates: What Statistical Analysis Reveals About Casino Game Returns
Return to Player percentages represent a core metric in casino game evaluation, and statistical analysis provides the tools to interpret what these figures actually mean over extended play periods. Researchers examine large datasets from gaming platforms to separate theoretical RTP from observed outcomes, revealing patterns that emerge only through rigorous number crunching rather than isolated session results.
Defining RTP Through Data Lenses
Return to Player stands as the percentage of wagered money a game pays back to players across millions of spins or hands, yet this single number masks considerable complexity once analysts apply variance calculations and distribution models. Gaming regulators in multiple jurisdictions require operators to publish these rates, and studies conducted by research institutions show that actual returns cluster around theoretical targets when sample sizes exceed several hundred thousand rounds. Those who examine monthly payout reports notice that short-term fluctuations often deviate sharply from long-term expectations because random number generators produce results within predictable probability bands rather than fixed sequences.
Statistical Methods Applied to Game Returns
Analysts rely on Monte Carlo simulations and regression techniques to test whether a game's reported RTP holds steady under different volatility conditions, and data from November 2026 indicates tighter alignment between advertised figures and measured performance across major European markets. Standard deviation measurements help quantify how widely results can swing around the mean return, which explains why high-volatility slots display wider outcome spreads even when their RTP matches that of steadier table games. Observers tracking industry reports find that combining RTP data with hit frequency statistics produces more accurate forecasts of session length and bankroll requirements than RTP alone can deliver.
Comparative Analysis Across Game Categories
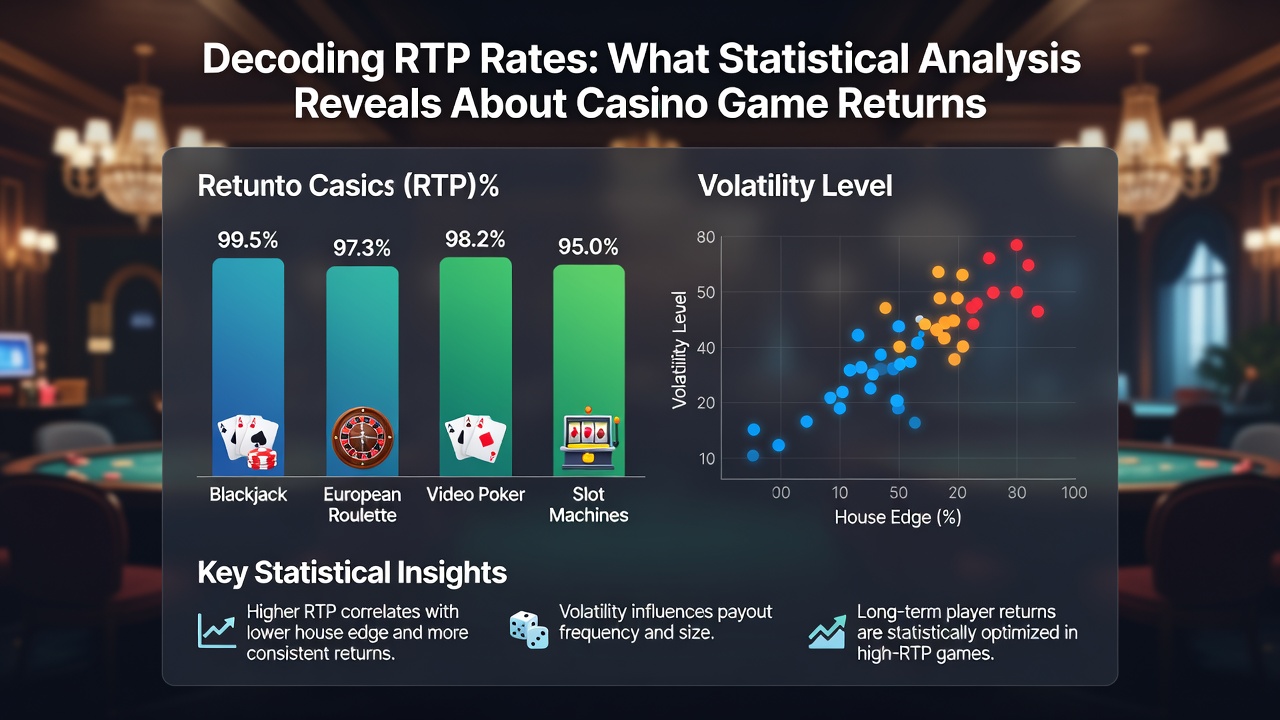
Table games such as blackjack and roulette typically post higher RTP values than most slot machines because their mathematical structures contain fewer random elements, while video slots incorporate bonus rounds and multiplier features that increase variance without necessarily altering the underlying return percentage. Statistical breakdowns published by academic groups reveal that progressive jackpot slots often carry lower base RTP to fund the accumulating prize pools, and players who review aggregated payout data from multiple operators notice these adjustments appear consistently across different software providers. European studies conducted in recent years demonstrate that live dealer games maintain RTP levels comparable to their random number generator counterparts when measured over equivalent hand volumes.
External Factors Influencing Observed Returns
Bonuses and promotional mechanics alter effective RTP during limited time windows because wagering requirements and contribution rates shift how much of each bet counts toward playthrough targets, and analysts adjust their models accordingly when evaluating real-world player outcomes. Regulatory updates in regions outside the United Kingdom continue to emphasize transparent RTP disclosure, while research from Canadian provincial gaming authorities and Australian academic centers highlights how game design choices around reel configurations and payline structures affect the speed at which returns converge to theoretical values. Those examining cross-jurisdictional datasets observe that mobile platform performance mirrors desktop results when identical game versions run on the same random number generator seeds.
Long-Term Patterns Revealed by Large-Scale Data
Meta-analyses of casino transaction records demonstrate that aggregate player returns approach published RTP percentages after roughly one million game rounds, although individual experiences vary widely due to the law of large numbers operating across diverse player behaviors and stake sizes. Industry organizations tracking global gaming trends report that slots with RTP above 96 percent attract higher play volumes in regulated markets, and statistical tests confirm these preferences correlate with measurable differences in session duration rather than subjective appeal. November 2026 data releases from multiple oversight bodies showed minimal drift between certified RTP values and actual payouts across thousands of active titles, reinforcing confidence in existing testing protocols.
Conclusion
Statistical analysis transforms RTP from a marketing claim into a verifiable performance indicator by applying probability theory and large-sample testing to real gameplay records, and continued data collection from diverse regulatory environments strengthens the precision of these evaluations. Observers monitoring evolving game libraries note that emerging titles incorporate more complex feature sets while maintaining consistent return percentages, which suggests the underlying mathematics remain stable even as player interfaces advance. Those reviewing future reports will likely find that refined analytical methods continue to clarify the relationship between advertised RTP and actual casino game returns across expanding digital platforms.